



Trading Strategies · Beginner · 7 min read
EMA Crossover Strategy: Setup, Signals and Execution
How EMA crossovers signal trend direction
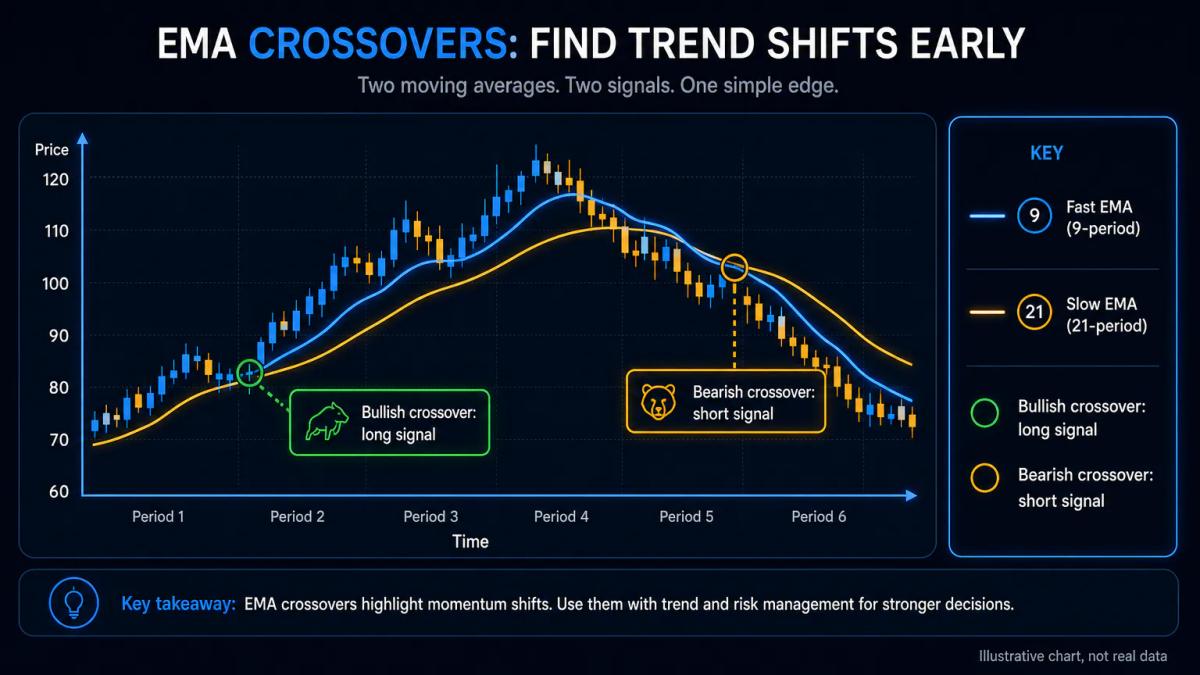
An EMA crossover strategy uses two exponential moving averages of different lengths on the same chart.
When the faster EMA crosses above the slower EMA, momentum has shifted up and the setup calls for a long entry; when the faster line crosses below, momentum has turned down and the setup calls for a short or an exit. The intersection matters because the faster EMA reacts more quickly to recent prices than the slower one, so their meeting point marks the moment where short-term direction disagrees with the older trend.
The EMA cross indicator works best when price is trending, because a real crossover implies a change in the balance between recent and older closes. In sideways price action the two lines braid around each other and produce noise. Before you act on any cross, you want to see that the market has room to move: a clear swing, expanding candles, and a level of support or resistance behind you.
Putting this into practice means opening an account: start with the best forex brokers our team reviewed.
What is an EMA and why it matters for crossover trading
An exponential moving average (EMA) is a trend-following line that weights recent prices more heavily than older ones. Compare it with a simple moving average (SMA), which gives every price in the window equal weight. Because the EMA loads the newest bars more aggressively, it turns faster when price changes direction, and that responsiveness is the whole reason a crossover system uses it.
For a crossover trader, earlier turns mean earlier entries, and earlier entries mean a bigger slice of the move before the crowd arrives. The trade-off is that faster lines also react to short-term noise, so an EMA cross triggers more often than an SMA cross, and a share of those triggers will be wrong.
Understanding how to trade momentum stocks helps you recognize when that responsiveness works in your favour and when it creates false signals. The EMA strategy is not about catching every signal; it is about filtering the signals worth taking.
Popular EMA period combinations and when to use them
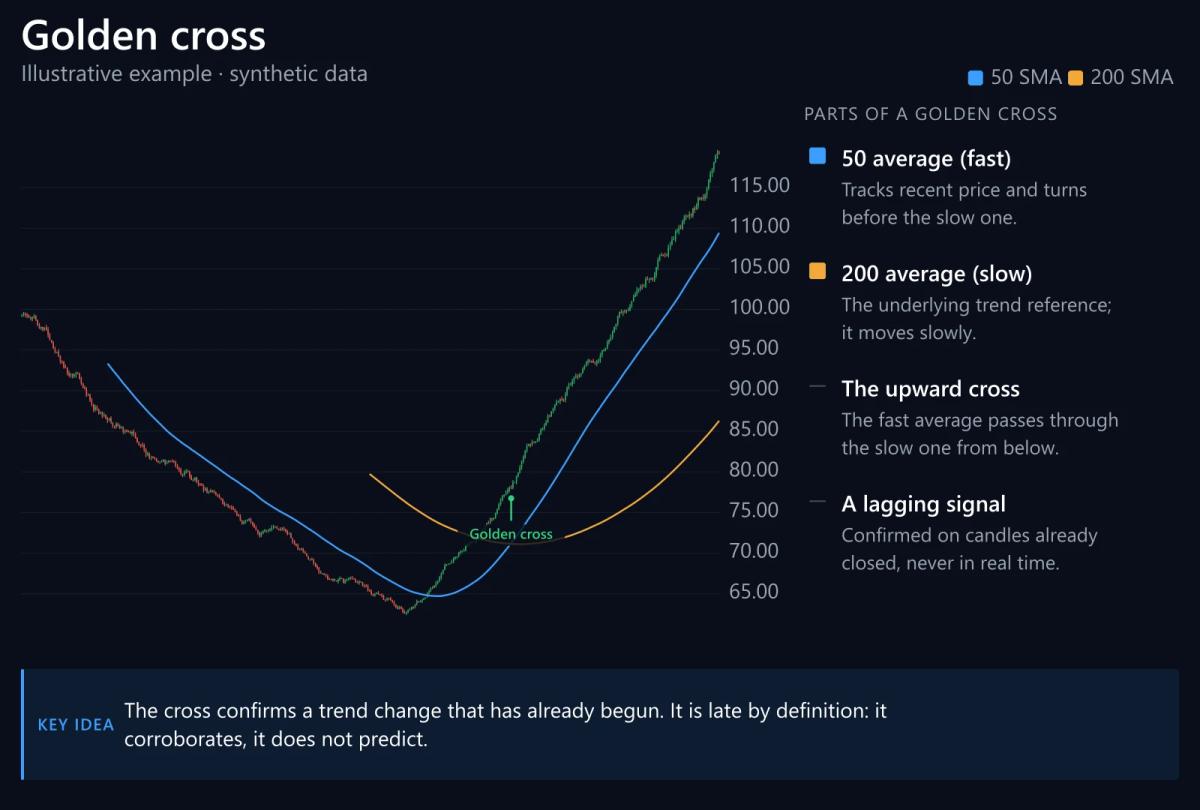
The period pair you pick decides how many signals you see and how much lag you accept. Shorter pairs, like 5 and 8, fire constantly and suit scalpers who exit within minutes. Medium pairs, 9 and 21, suit intraday and short swing trading. Longer pairs, like 50 and 200, fire rarely and suit position trading, where a single cross may define months of exposure.
| EMA pair | Style | Typical timeframe | Signal frequency |
|---|---|---|---|
| 5 / 8 / 13 | Scalping | 1m to 5m | Very high |
| 9 / 21 | Day trading | 5m to 1h | High |
| 10 / 20 | Short swing | 15m to 4h | Medium |
| 12 / 26 | Swing | 1h to daily | Medium |
| 50 / 200 | Position | Daily to weekly | Low |
A useful rule: the shorter the timeframe, the more filters you need, because more of the crosses will be noise. On daily charts a 50/200 cross, often called the golden cross or death cross, already contains most of its own filter, because a slow EMA barely moves without a real trend behind it.
On a 1-minute chart, a 5/8 cross carries almost no information on its own. The distinctions between day trading, swing trading and scalping matter because each style demands a different EMA pair and timeframe.
Step-by-step execution: entering and exiting on crossovers
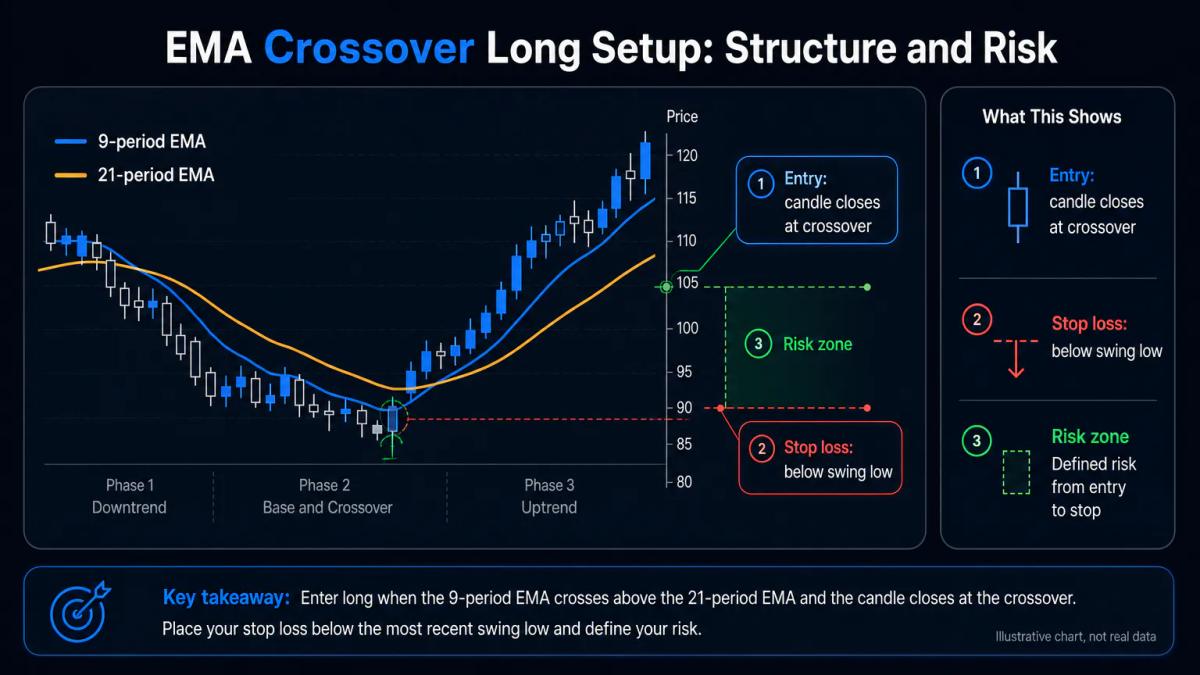
Start by adding two EMAs to your chart; a 9-period and a 21-period pair is a good default for intraday work.
Wait for the current candle to close with the fast EMA on the other side of the slow EMA: acting on an intra-bar cross that later reverts is one of the most common ways beginners lose money on this setup. Once the candle closes, the signal is valid.
- For a long, place your stop loss, the price where you accept the trade is wrong and exit, just below the most recent swing low.
- For a short, place it just above the most recent swing high.
Measure the distance from your entry to that stop in pips, the smallest standard price move in a forex pair, usually 0.0001, or in price for other assets. Set your take profit at least twice that distance away, so your risk-to-reward is 1:2 or better.
A worked example: EUR/USD prints a 9/21 bullish cross on the 1-hour chart at 1.0850, with the last swing low at 1.0820. Your stop sits at 1.0818, 32 pips of risk. A 1:2 take profit sits at 1.0914. If the trade hits your target, you make 64 pips; if it hits your stop, you lose 32. You need to be right just over one time in three to break even.
Filtering false signals with volume and support levels
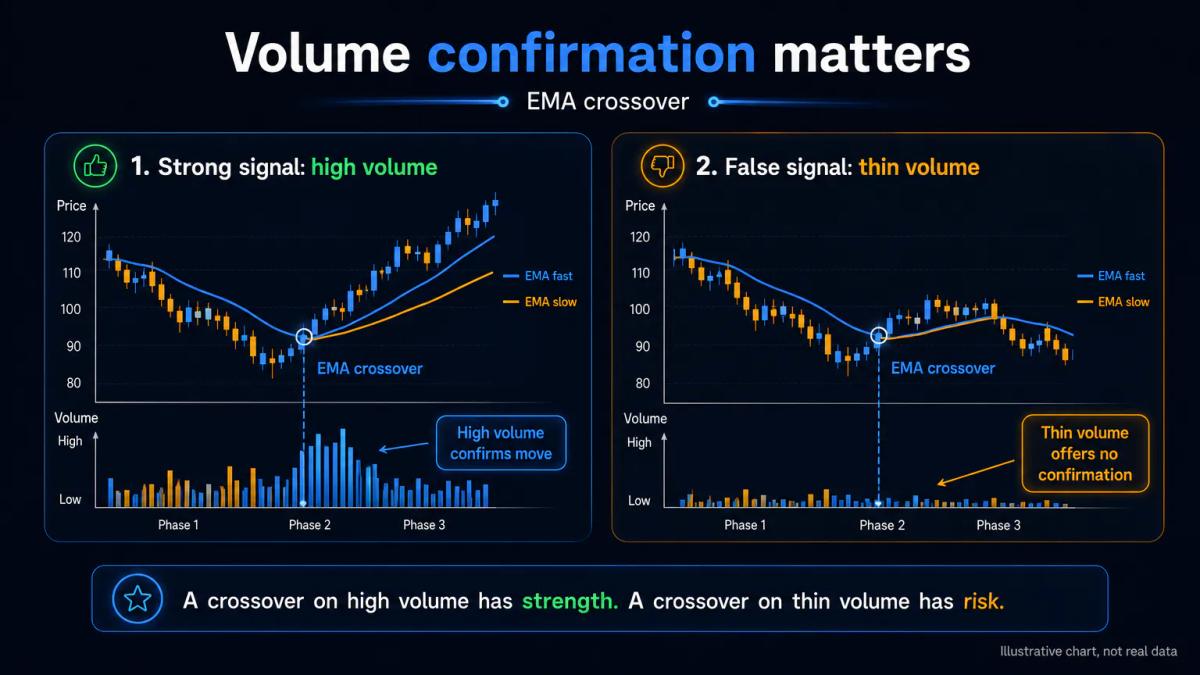
Raw EMA crossover signals whipsaw in ranges. Three filters cut most of the bad trades.
- First, look at volume: a cross that happens on rising volume has more conviction than one on thin trade.
- Second, check structure: a bullish cross well above a recent support level, or a bearish cross well below a resistance level, is more trustworthy than a cross in the middle of a tight range.
- Third, check higher-timeframe alignment: if the 1-hour trend is up, take longs on the 5-minute cross and skip the shorts.
Understanding continuation vs. reversal patterns helps you distinguish between a genuine trend change and a temporary pullback that will reverse again.
A fourth filter compares the EMA cross with a second indicator. The moving average convergence divergence (MACD) line crossing zero in the same direction confirms momentum.
The average directional index (ADX) above 25 confirms that a trend exists at all: below 20, the market is ranging and crosses will fail more often than they work. If two of these confirmations line up with the cross, the setup is worth taking.
Risk management and position sizing for EMA trades
Risk per trade is more important than any signal. Size each position so that hitting your stop loss costs no more than 1% to 2% of your account.
On a £10,000 account with a 50-pip stop, that means the pip value multiplied by 50 must not exceed £100 to £200. In EUR/USD, one micro lot (0.01 lot) is worth about £0.80 per pip, so a 50-pip stop on one mini lot (0.10) costs around £40: safely inside the limit.
According to the FCA, most retail investor accounts lose money when trading CFDs. The discipline that keeps you in the surviving minority is unglamorous: fixed percentage risk, a hard stop, no revenge trades after a loss, no adding to losers, and a daily loss limit that ends your session.
UK retail clients face FCA leverage caps of 30:1 on major forex, 20:1 on major indices and 5:1 on individual equities, and CFDs on cryptoassets are prohibited for UK retail; those caps set the ceiling on how large a position you can open, not a target.
Applying EMA crossovers across forex, crypto, and stocks
EMA crossovers work on any liquid market, because they measure momentum, not asset type. Forex majors, large-cap equities and index CFDs all respond to the same mechanic. The right period pair, though, is asset-specific.
Forex scalpers commonly run 5/8/13 on 5-minute charts; equity swing traders often prefer 9/21 or 20/50 on daily charts, where overnight gaps make short timeframes less reliable. Understanding the best time to trade forex and how market hours affect liquidity helps you choose the right timeframe for your EMA pair. Index traders sit in between, using 10/20 or 12/26 on 1-hour and 4-hour charts.
Before you commit real money, backtest the exact pair you plan to trade on the exact timeframe over at least two years of data, including both a trending phase and a ranging phase. Track win rate, average win, average loss and maximum drawdown, the largest peak-to-trough fall in the equity curve. If the strategy survives both regimes with a positive expectancy, forward-test it on a demo account for a month before going live.
Frequently Asked Questions
What is the difference between an EMA crossover and a simple moving average crossover?
Both compare two moving averages of different lengths, but the EMA weights recent prices more heavily than older prices, while the SMA weights every price in the window equally. In practice the EMA turns first, so an EMA crossover fires earlier than an SMA crossover on the same periods. That is useful when you want an early entry, and unhelpful when you want a slower, less noisy filter.
Can you use more than two EMAs in a crossover strategy?
Yes. Three-EMA setups such as 5/8/13 use the middle line as a confirmation filter: a long is valid only when the fast line is above the medium line and the medium line is above the slow line. This reduces false signals in choppy conditions, at the cost of entering later. Some traders also add a very slow EMA (like the 200) purely as a trend filter and take crosses only in its direction.
What timeframe works best for EMA crossover trading?
There is no single best timeframe; it depends on how long you want to hold and how much noise you can tolerate. Lower timeframes (1-minute, 5-minute) produce many signals but a high share of false ones. Higher timeframes (1-hour, 4-hour, daily) produce fewer signals but each one carries more weight. Beginners are usually better served starting on the 1-hour or 4-hour chart, where a single trade lasts hours or days rather than minutes.
How do I know if my EMA crossover strategy is profitable before trading real money?
Backtest the exact period pair, timeframe and asset over at least two years of data that include both trending and ranging periods, and record win rate, average win, average loss and maximum drawdown. If the expectancy is positive and the drawdown is one you can sit through, forward-test on a demo account for four to eight weeks with the same rules and position sizing you plan to use live.
Why do EMA crossovers fail in sideways or ranging markets?
In a range, price oscillates around a mean, so the fast and slow EMAs cross back and forth without price making meaningful progress in either direction. Each cross triggers an entry, and each reversal triggers a stop-out. The ADX indicator can help: readings below 20 suggest a ranging market where crossover systems tend to lose money, and traders often stand aside until ADX rises above 25.
About the authors


Put this into practice
Brokers we have reviewed
Scored on the same five dimensions. Here are three of them — the full list is on the brokers page.



Related articles

How to Trade Momentum Stocks: Entry, Exit, and Risk Rules
A plain-English guide to trading momentum stocks: how to screen, when to enter on pullbacks or breakouts, where to exit, and how to size positions safely.

Insider Trading: Definition, Laws, and Penalties for Retail Traders
A retail-focused breakdown of insider trading law: Rule 10b-5, material nonpublic information, criminal penalties, prosecuted cases, and how to legally read Form 4 filings.

Is Day Trading Worth It? A Realistic Look at Costs, Risk, and Who Actually Succeeds
A grounded answer to whether day trading is worth it for retail traders: real costs, tax bite, regulatory limits, failure rates and the alternatives.
0 comments