



Technical Analysis · Beginner · 8 min read
Morning Star Pattern: How to Spot and Trade This Reversal Setup
The three-candle reversal that signals a shift from selling to buying
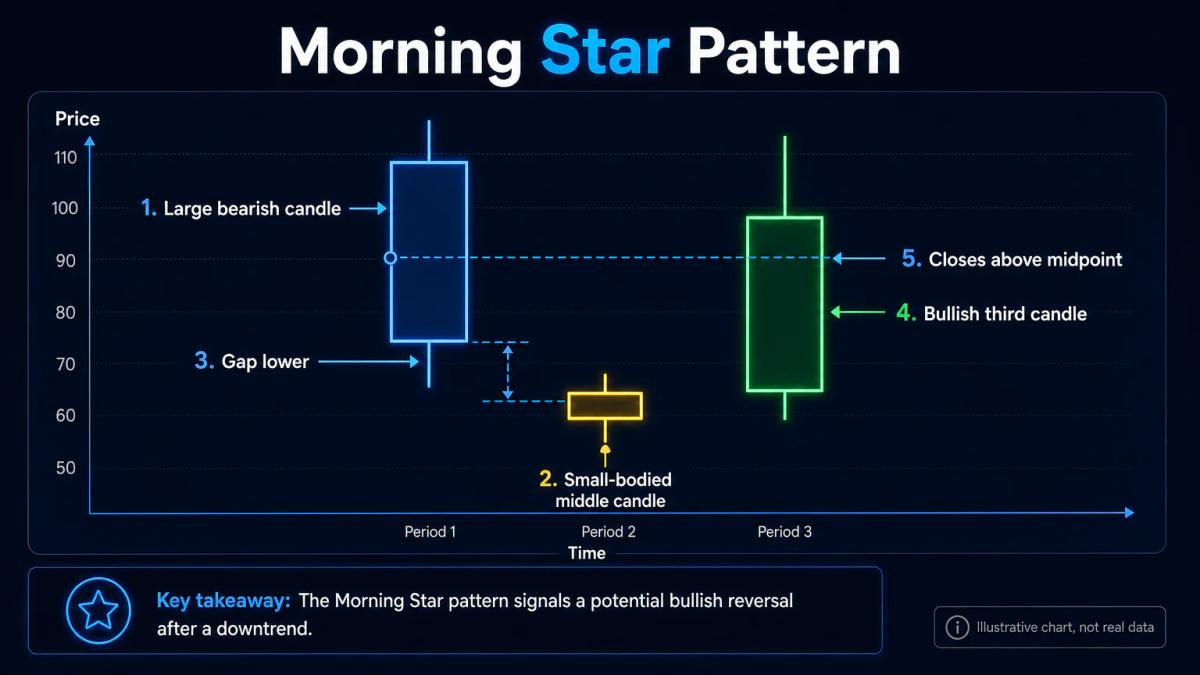
The morning star pattern is a reversal formation that appears at the bottom of a downtrend and signals a potential shift from bearish to bullish momentum.
The setup consists of a large bearish candle, a small-bodied indecision candle that gaps lower, and a bullish candle that closes well into the body of the first candle, creating a visual 'star' shape on the chart.
A candlestick is a chart element that shows the open, high, low and close of a price bar within one time period. This pattern matters because it gives you a concrete entry signal when the market is transitioning from sellers in control to buyers stepping in. Instead of guessing where a fall might end, you wait for three specific candles to line up before acting. That structure is what makes the morning star one of the first patterns most technical traders learn, and one of the few reversal signals with clear rules for entry, stop placement and invalidation.
Understanding bullish candlestick patterns and how they form is essential to recognising the third candle's confirmation signal.
If you still need a broker, our guide to the best forex brokers compares the regulated options side by side.
How to identify the three candles and confirm the pattern
Identifying a morning star pattern requires you to spot three specific candles in sequence: a large bearish candle showing strong selling pressure, followed by a small-bodied candle whose open and close sit very close together (often called a 'star' or a doji when they are almost equal), and finally a bullish candle that closes above the midpoint of the first candle's body. Ideally, the small middle candle gaps below the low of the first candle, meaning it opens beneath the previous close with no overlap.
A gap is an empty space on the chart where price jumped between the close of one candle and the open of the next; gaps are common in stocks but rarer in 24-hour markets like forex and crypto, where you should treat a very small body near the previous low as an acceptable substitute.
Understanding what liquidity means in trading helps explain why gaps behave differently across asset classes.
The third candle is the confirmation: the deeper it closes into the first candle's body, the stronger the reversal signal. A close that only nibbles into the first candle carries less weight than one that recovers three-quarters of the initial drop.
Before you accept the setup, check that there is an actual downtrend behind it: a series of lower highs and lower lows over the preceding 10 to 20 candles. A morning star that appears inside a sideways range is not really reversing anything.
Learning how to identify market trends will help you confirm the downtrend context that validates the pattern.
Why timeframe and volume matter for pattern reliability
The timeframe you trade on directly affects how reliable a morning star becomes.
Patterns on daily or 4-hour charts tend to carry more weight than those on 5-minute charts because they reflect larger pools of participants and less random noise. A daily morning star on a large-cap stock represents a full session of collective decision-making; a 5-minute version can form and dissolve on a single institutional order.
Volume confirmation strengthens the pattern: if the third bullish candle closes on above-average volume (higher than the 20-candle average volume shown on most charting platforms), it suggests genuine buying interest rather than a temporary bounce.
Ideally, the first bearish candle also prints heavy volume, the middle candle prints lower volume (indecision), and the third candle prints the highest of the three. That sequence, heavy, light, heavier, mirrors the underlying psychology of capitulation, pause and accumulation.
Without volume confirmation, treat the pattern as tentative and reduce your position size accordingly.
Morning star versus evening star: the opposite reversal pattern
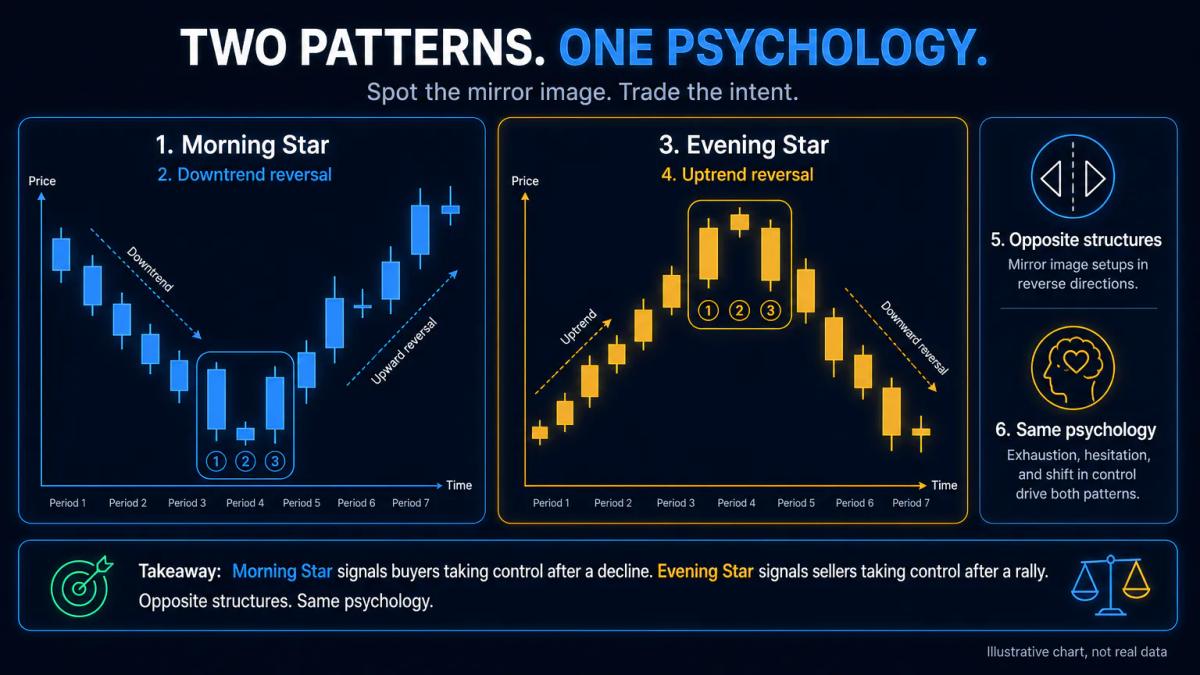
The evening star is the inverted mirror of the morning star. It appears at the top of an uptrend and signals a shift from bullish to bearish momentum. Where a morning star opens with a large bearish candle, gaps lower and closes bullish, an evening star opens with a large bullish candle, gaps higher into a small-bodied middle candle, then closes bearish deep into the first candle's body.
Both patterns rely on the same three-candle structure and the same psychology of exhaustion followed by reversal, but they point in opposite directions.
Learning about bearish candlestick patterns will deepen your understanding of how evening stars form and behave. The comparison below covers the details you actually trade against.
| Feature | Morning star | Evening star |
|---|---|---|
| Trend before pattern | Downtrend | Uptrend |
| First candle | Large bearish | Large bullish |
| Middle candle | Small body, gaps down | Small body, gaps up |
| Third candle | Bullish, closes into first body | Bearish, closes into first body |
| Signal direction | Bullish reversal | Bearish reversal |
| Typical entry | Break above third candle high | Break below third candle low |
| Stop-loss location | Below middle candle low | Above middle candle high |
Recognising both patterns doubles your opportunities, since the same reading skill applies to spotting tops and bottoms.
Entry, stop-loss, and position sizing for morning star trades
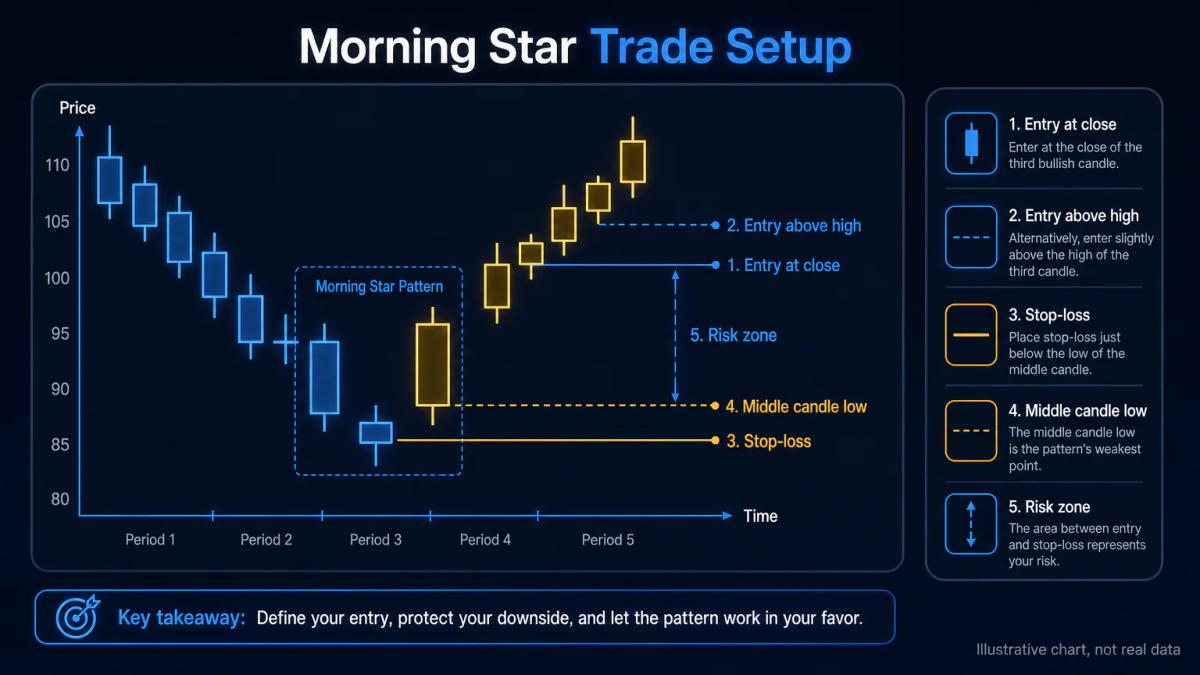
A common entry point is the close of the third bullish candle, or a break above its high on the following candle. The break-above-high entry gives you extra confirmation at the cost of a slightly worse price. Your stop loss, an automatic order that closes the trade if price moves against you, typically sits just below the low of the small-bodied middle candle, which marks the pattern's weakest point. If price returns there, the reversal thesis is broken.
Position size then depends on the distance from entry to stop loss.
- Suppose your entry is at $52.00, your stop is at $50.00, and you have decided to risk £100 per trade.
- The distance is $2.00 per share, so you buy 50 shares: if the stop hits, you lose exactly £100 (currency conversion aside).
- A widely cited rule of thumb from professional risk management is to risk no more than 1% to 2% of account equity per trade, so on a £10,000 account your risk per trade would be £100 to £200.
Understanding leverage trading mistakes and proper position sizing will help you avoid over-leveraging on morning star setups. The pattern's size therefore dictates your quantity, not the other way round: a wide morning star means a smaller position, a tight one means a larger position, and your monetary risk stays constant.
Common false signals and how to filter them
False morning star signals occur when the pattern forms but buying pressure fades quickly, sending price back through the middle candle low. To filter these out, apply three mechanical rules before you take the trade.
- First, require the third candle to close above the 50% midpoint of the first candle's body; anything shallower is a weak signal.
- Second, require above-average volume on the third candle relative to the previous 20 candles.
- Third, require a clear prior downtrend, defined as at least three lower highs and lower lows on the timeframe you are trading.
Avoid trading the pattern in choppy, sideways markets: reversals are less likely to stick when there is no trend to reverse. A morning star inside a range often marks the low of the range rather than the start of a new uptrend, so any long trade there is really a mean-reversion trade and should be sized and exited accordingly. If the pattern forms right into obvious resistance, a prior swing high, a moving average, a round number, expect a shorter move and take partial profits earlier.
Skipping trades that fail these filters costs nothing; taking every setup that superficially looks like a morning star is what drains beginner accounts.
Morning star patterns across stocks, forex, commodities, and crypto
The morning star pattern works across all major asset classes because it reflects universal market psychology: the shift from selling pressure to buying interest.
- In equities, it often appears after earnings-driven sell-offs and post-market gap-downs, where the middle candle gap is genuine and visible.
- In forex, where markets trade 24 hours a day, the middle candle rarely gaps but instead prints a very small body near the prior low, so you rely more on body size and closing position than on gap geometry.
- In commodities, morning stars often follow supply-driven declines in oil, gold or agricultural futures, and daily charts tend to give the cleanest signals.
- In crypto, where volatility is higher and 24/7 trading means constant continuation, morning stars appear frequently on 1-hour and 4-hour charts after panic selling; expect faster follow-through and faster failures, and tighten your stop distance to match.
The core three-candle structure and identification rules remain the same across all four asset classes: only the timeframe expectations and the treatment of gaps change.
Frequently Asked Questions
What is the morning star pattern candlestick and what does it signal?
The morning star is a three-candle formation appearing at the end of a downtrend. It signals a potential bullish reversal: sellers exhaust themselves on the first candle, indecision prints on the small middle candle, and buyers take control on the third bullish candle that closes into the first candle's body.
What is the evening star candle pattern and what does it signal?
The evening star is the inverted mirror of the morning star. It forms at the top of an uptrend with a large bullish candle, a small-bodied indecision candle that gaps higher, and a bearish candle that closes deep into the first candle's body, signalling a potential shift from buying to selling pressure.
What are the fundamental differences between the evening star candle pattern and the morning star pattern?
They share the same three-candle structure but point in opposite directions. The morning star ends a downtrend and is bullish; the evening star ends an uptrend and is bearish. The colour sequence flips (bearish, small, bullish versus bullish, small, bearish), and stops sit below the middle candle for morning stars and above it for evening stars.
How do you trade the morning star pattern and the evening star pattern?
For a morning star, enter on the close of the third bullish candle or on a break of its high, place the stop just below the middle candle low, and size the position so the stop-loss loss equals your fixed risk amount. For an evening star, mirror everything: enter short on the close of the third bearish candle or a break of its low, and place the stop just above the middle candle high.
Can a morning star pattern fail, and how do you avoid false signals?
Yes, it can fail when buying interest evaporates and price returns below the middle candle low. To reduce false signals, require a clear prior downtrend, a third candle that closes above the 50% midpoint of the first candle's body, and above-average volume on that third candle. Avoid trading the pattern inside sideways ranges.
About the authors


Put this into practice
Brokers we have reviewed
Scored on the same five dimensions. Here are three of them — the full list is on the brokers page.



Related articles

Moving Average Crossover Strategy: Golden Cross, Death Cross, and False Signals
A practical guide to the moving average crossover: mechanics, golden and death cross patterns, period selection, stop placement, and filters for false signals.

Nison Japanese Candlestick Charting Techniques: How to Read Price Action
Nison Japanese candlestick charting techniques explained for retail traders: core patterns, common mistakes, asset-class nuances, and the platforms that support pattern analysis.

Pennant Pattern: Definition, Trading Strategy, and Breakout Signals
A practical guide to the pennant pattern: how it forms, how to trade bullish and bearish breakouts, and how to size positions while filtering false signals.
0 comments